Normalising geometric data is not a problem solving exercise that immediately springs to mind when you initially join the Sports UI team at bet365.
What does geometry have to do with sports betting?
As part of bet365’s In-Play Sports offering, we have enhanced several sports; with a feature we call “Match Live”.
We know that our customers may not always be able to catch the sports they have placed a bet on, Live on TV. The Match Live feature enables customers to get an overview of the latest scores and view several different statistics for the Matches that are in-play.

Our Soccer Match live was one the first Match Live’s to be released, the latest sport to join the Match Live feature family is Australian Rules football.
Australian Rules Football – An Elliptical Conundrum
If you’re not familiar with Australian Rules football it’s well worth a look, imagine Rugby being played on an elliptical Cricket playing field.
It’s the shape of the Australian Rules playing field that starts us on our journey into the world of geometry.
The Problem
When we started looking to implement Match Live for Australian Rules football, we found that there isn’t a set dimension for the playing field. The official rules for Australian Rules football (AFL) state, the playing surface must be;
- Between 135 metres and 185 metres in length;and
- Between 110 metres and 155 metres in width.
In order for us to make the best use of space within the match live containing div. We opted for the following playing field dimensions below.
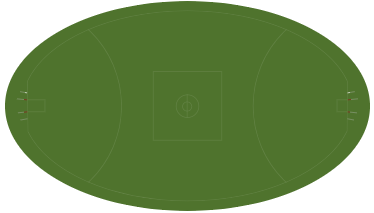
As events happen in the game, we display animations on the playing field in the exact location where the event has occurred. During the discovery phase we decided to put together a prototype to see how events would be distributed across the pitch, to make sure we wouldn’t experience any issues when plotting the animations.
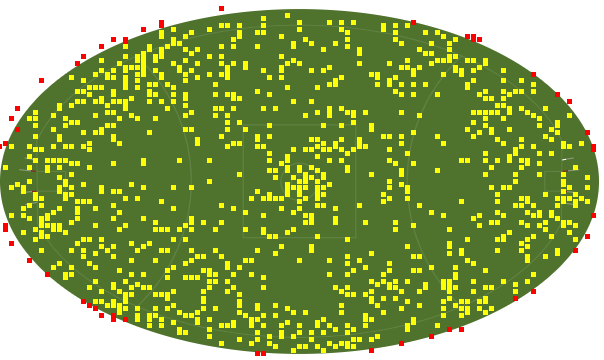
This was the outcome of our prototype.
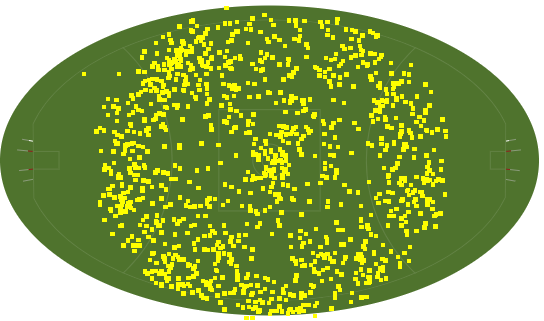
We found that the events X and Y coordinates were mapped based on the dimensions of the Melbourne Cricket Ground (MCG). The MCG is where the finals of the Australian Football League are played. We found that the data coordinates were mapped to the MCG playing field dimensions irrespective of the ground the match was being played.
The proof of concept highlighted two problems that we needed to solve.
- How to do we scale the events onto a playing field with different dimensions?
- What do we do with the anomalies, where an “out of bounds” event appears outside of the playing field boundary?
The Solution
Tackling the Scale Problem
As events occur, the UI receives event data from our back end systems, each event data snippet contains information such as the time, team id, the type of event and a location of where the event occurred on the playing field.
The location data is returned in X and Y event attributes. The X,Y values returned to the UI are based on the Cartesian co-ordinate system. This means that the center of the playing field would have the X,Y co-ordinates of 0,0 (also know as the origin). If an event occurs on the left hand side of the playing field the X co-ordinate would be returned as a negative number, the Y co-ordinate would also be a negative number if it was in the bottom half of the playing field.
Below is an example of the UI playing field (outer ellipse), and the playing field of the MCG playing field (inner ellipse) drawn onto a Cartesian graph.
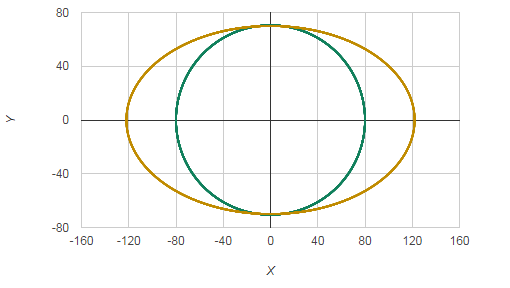
As the positioning of HTML elements in the browser doesn’t follow the Cartesian system, we need to convert the Cartesian co-ordinates to their pixel equivalents, in our case we chose to do this by specifying the pixels away from the left and top of the containing div.
Here are the calculations we used to convert from the X, Y coordinated to the left and top pixels.
![]()
![]()
If we substitute the values in the equation with the dimensions of the MCG playing field, using the left most position from the origin X,Y co-ordinates of -80,0. We get the following values.
Pixels from Left
![]()
Pixels from Top
![]()
Using these calculation on there own, would work if we wanted to show the playing field using the MCG dimension, however we want to show the event on our elongated elliptical playing field.
The dimensions of the playing field we wish to use is 244 x 140. So for the data points -80,0, we actually wish to plot the event at the -122,0 location.
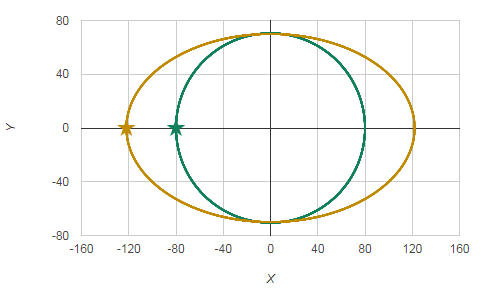
We can achieve this by converting the values to percentages (on each axis) rather than using the fixed pixel dimensions, we can apply those percentages to the elongated ellipse dimensions, and convert back to pixels.
Pitch Size Adjusted Pixels from Left
![]()
Pitch Size Adjusted Pixels from Top
![]()
The calculations above will generate values with decimal places so we would also round them to 0 decimal places.
This allowed us to solve our first issue for scaling event locations to different playing field dimensions.
The Anomalies
The second problem we noticed, when events such as out of bounds occur, we noticed that the co-ordinates could be returned outside of the field of play. As we are trying to plot animations on the playing field, it wouldn’t be great if they were nowhere near the playing field.
Ideally we wanted to be able to render the animation directly on the boundary, so our first task was to identify which events were outside of the field of play.
Using the Cartesian co-ordinates of the event we are able to calculate if the event is outside of the ellipse, using the equation below.

If the value is >=1, then we are able to pin point which events occur outside of the boundary. Where X,Y is the co-ordinate and H and W is the height and width of the playing field.
Once we had pin pointed the anomalies, we wanted to be able to adjust the position of the event. If we were to draw a line from event location to the origin (0,0), we would want the event to appear where the ellipses path intersects that line.
Using the following equations we were able to work out what the new X and Y co-ordinates would be, so that it would appear on the ellipses path.
Corrected X Equation

Corrected Y Equation

After moving the event location, this is how the events are distributed across the playing field.
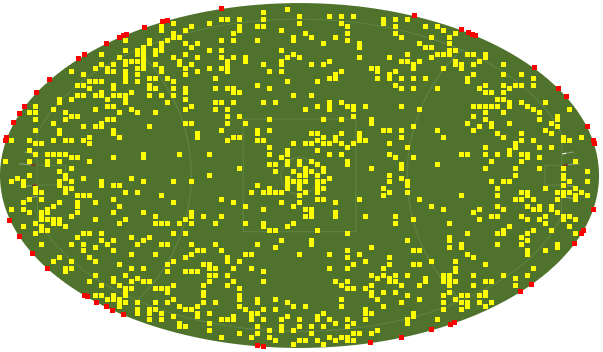
When we started putting this project into build, we ultimately decided that the boundary correction calculations should be performed further up the stack as it didn’t make sense for each customer browsers to perform the same corrections over and over again.
Conclusion
By putting together a proof of concept we were able to quickly identify any problems, and solve them. This minimised the unknowns of the project, improved our estimates and helped us take the feature from concept to a productionised feature with no major hiccups during the development phase.